Workflow Teardowns
Share:
Copy link
Copied!
Refreshing a deck you built by hand: what Claude can and can't do
It's the last week of the month. You built the close package last month — forty-plus slides, most of them dense with numbers, half of them tables that took an evening to align. This month, most of that has to update. New actuals, new flux commentary, a refreshed balance-sheet variance table, a new waterfall on the enrollment slide. The structure hasn't moved. The layouts haven't moved. The last thing you want to do is rebuild any of it from scratch.
So the question isn't can AI make me a deck. The question is: I've already got a deck. Can AI refresh it. And the honest answer is more interesting than "yes" — because to give a good answer, you first have to understand what a deck you built by hand actually is.
What's actually inside the file you're refreshing
Most finance close packages are built in one of two environments — PowerPoint directly, or Google Slides and then exported to .pptx when they need to travel. The example I dug into for this piece is the second kind, and the anatomy tells you almost everything about what's easy and what isn't from here.
When you export from Google Slides to .pptx, you get a file that opens cleanly in PowerPoint and looks right — but under the hood, it's carrying a lot. The theme (Omada's dark teal at #003D48, coral at #C44F23, Arial throughout) is baked in properly, which is the good news. So is the master layout with the coral quarter-circle in the corner and the "CONFIDENTIAL" footer. But a Google Slides export drops in roughly a hundred and fifty slide layouts you're not using, packages every chart as a flattened image (GoogleShape1050p231.jpg and its friends), and leaves the underlying color scheme in the theme file set to a completely different default palette that the actual slides then override, one text run at a time.
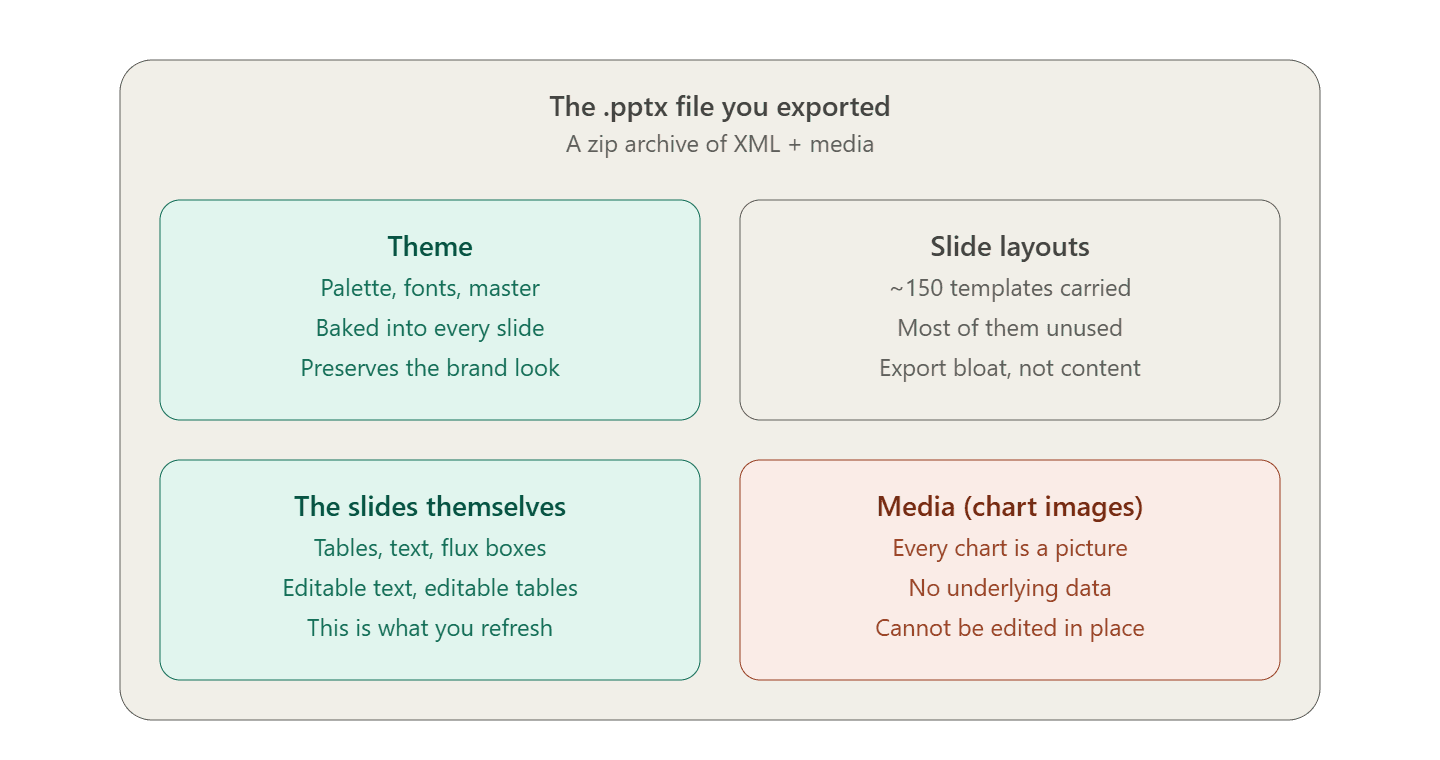
That coral quadrant on the bottom right is the one that matters. Every visualization in the deck — the enrollment waterfall on slide 12, the OPEX bar chart on slide 11, the year-over-year customer billings chart on slide 13 — is a .jpg. Not a chart object PowerPoint can re-render if you change the numbers. Not a link back to a Google Sheet. A picture. Whoever built the chart did it in Google Sheets, and the export flattened it to an image the moment it left the Google environment.
The practical consequence: any refresh that touches numbers on the tables is straightforward, because the tables are real. Any refresh that touches numbers on the charts means regenerating that chart somewhere else and dropping the new image back in. That's true whether a human refreshes the deck or Claude does. It's baked into the file, not into the process you use around it.
The two paths from here
There are two clean ways to structure a refresh workflow around this file. They trade off in different directions, and picking one is mostly about how much fidelity to the current visual you need against how much editability you'd like going forward.

Path A is the low-risk answer for most finance teams. You hand Claude your existing .pptx each month, tell it what changed — the actuals in the summary consolidated results table, the flux commentary on slide 18, the balance-sheet variance notes, the numbers in the FP-vs-actual quarterly view on slide 26 — and the file that comes back is your deck, refreshed, with everything else untouched. Nothing about fonts, colors, spacing, or the coral quadrant in the corner can drift, because nothing about them was ever regenerated. Charts stay images (which they were anyway); if a chart's numbers need to move, you regenerate that chart wherever you built it originally and swap the image.
Path B is where you'd end up if the file itself is the drag on your workflow. A leaner rebuild strips the export bloat, keeps only the layouts you actually use — title, agenda, section divider, dense table page, chart page, text-and-callouts page, appendix — and builds every chart as a native PowerPoint object. Which means editable in place, forever after. The trade is that a native PowerPoint chart won't render pixel-for-pixel identical to the Google Sheets chart it's replacing; the shapes, spacing, and axis handling are close but not the same. If that fidelity gap matters more to you than editability does, Path A wins by default. If you'd rather stop maintaining chart images in a separate Sheet and just keep the numbers next to the slides, Path B is worth the one-time cost.
My personal take:
The hidden cost of Path A is chart regeneration. Refreshing tables is easy; refreshing charts isn't. Every month you update the source data, regenerate each chart, export or screenshot it, paste it into the deck, and realign it. Across 10-15 charts, that's where most of the refresh time goes, and you repeat the same process every close.
Path B changes that. Once charts are native PowerPoint objects generated directly from the data you give Claude, the workflow becomes reusable. The prompt becomes a skill, the template becomes a fixed destination, and every new chart follows the same pattern. Over time, manual chart work disappears into a library of reusable skills.
That's the difference. Path A recreates last month's deck. Path B reduces the work required to build next month's.
"Rebuild" doesn't mean you rebuild anything in Excel first
The most common misread of Path B is that it requires an intermediate step — build the charts in Excel or PowerPoint yourself, then Claude assembles the deck around them. It doesn't. Native PowerPoint charts are objects the file format supports directly; Claude generates them programmatically. You hand over the underlying numbers, whatever form they're in — a pasted table from Sheets, a CSV, or just the raw figures in a message — and the script writes real chart objects into the file. When the deck opens in PowerPoint, those charts are fully editable: right-click, "Edit Data," update the values in the embedded worksheet, and the chart re-renders.
That covers virtually everything in a close package. Bar charts (the marketed leads by lead rank on slide 11), stacked bars, line charts, waterfalls (the enrollment YoY bridge on slide 12 and the revenue-to-AEBITDA bridge on slide 35), grouped columns — PowerPoint has a native form for each. The only chart types you'd have to fall back to image renders for are the truly exotic ones — Sankey diagrams, chord diagrams, network graphs — and none of what's in the close package qualifies.
You also don't need PowerPoint or Excel installed to make any of this work. Claude builds the file in a sandboxed environment that has nothing to do with your machine. To open it, you need something that reads .pptx — that's PowerPoint, but it's also Google Slides (upload it and it converts to native Slides format on open), Keynote, LibreOffice, or the free Office 365 web app. If you're already living in Google Slides, the finished file drops into your Drive and behaves like any other Slides deck. The only reason to open it in actual PowerPoint at any point is to verify that native chart objects render exactly as you want — Google Slides' handling of embedded PowerPoint charts is close but not perfect, and if that matters, opening the file once in PowerPoint or Office 365 online catches any surprises.
What Claude can't do with a Google Slides link
The next question, and it's the honest one to ask, is: fine, but instead of downloading and uploading files, can I just give Claude a link to my Google Slides deck and have it edit the deck directly?
The answer is no, and it's worth being specific about why, because the constraint is the same whether you send a link or a file.
Claude's Google Drive access, as it exists today, includes tools for reading a Drive file, downloading its content, copying it, checking its sharing permissions, and creating new files. It doesn't include a tool for editing an existing Google Slides file in place. There's no "reach into slide 18 and change the number in this table cell" action. So if you send a link, the most Claude can do is download the file (Drive exports Slides as .pptx under the hood), work on a local copy the same way it would on a file you attached directly, and hand you back a new file. The original Slides deck sitting in your Drive is untouched. There's no version of this workflow where you watch Claude edit your live deck and see changes appear mid-session.
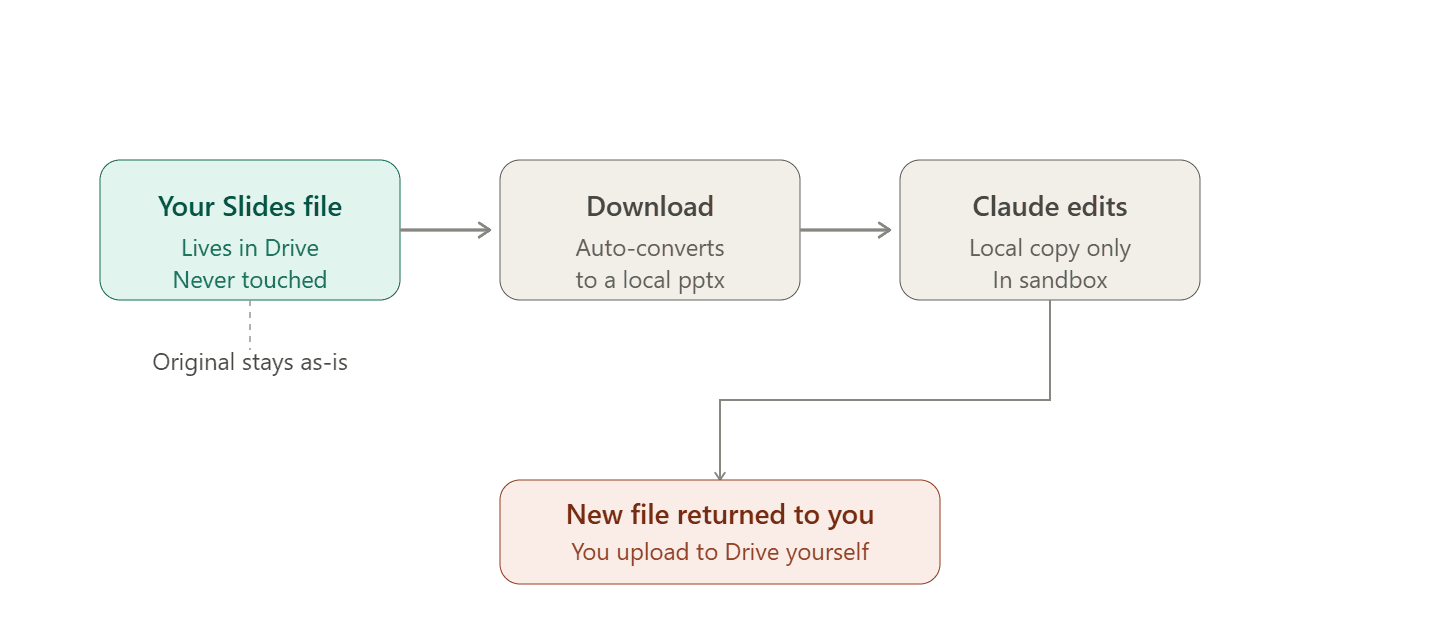
The Google Sheets question is worth a separate note, because it comes up constantly for close packages that pull data from live-linked models. If any of your charts are still linked to the original Sheets — either directly in Slides, or in the source workbook — Claude has no path to refresh them from source. Two reasons, and they compound. First, Google's export-to-.pptx flattens live-linked charts into images at export time; the link doesn't survive the format conversion, so the file Claude sees is already frozen. Second, even in a live Slides environment where the links are intact, Claude has no ability to trigger a "refresh chart from source" action inside Slides, and no automatic access to your Sheets. Whether the source Sheets are private or shared changes nothing about that.
If you want live-linked charts to update, you refresh them yourself in Sheets and re-export the Slides file. Then Claude works on the refreshed export. Or, on Path B, you pass Claude the underlying numbers directly and never need the Sheets link at all — the numbers become embedded worksheet data inside the native chart objects, decoupled from any external source.
Cowork is the real answer for "just work on my files"
If the friction you're actually trying to remove is the upload-download loop — the fact that every session starts with attaching a file and ends with saving one — the answer is Claude Cowork paired with the Claude Desktop app.
Cowork works differently from what happens in a chat. You install the desktop app, start a Cowork session, and point it at a specific folder on your machine — say, a "Close Package" folder. You grant read/write access to that folder specifically. From then on, Claude can open, edit, and save files in that folder directly, without you handing over each file individually. The .pptx sits where it lives, and refreshes happen in place.
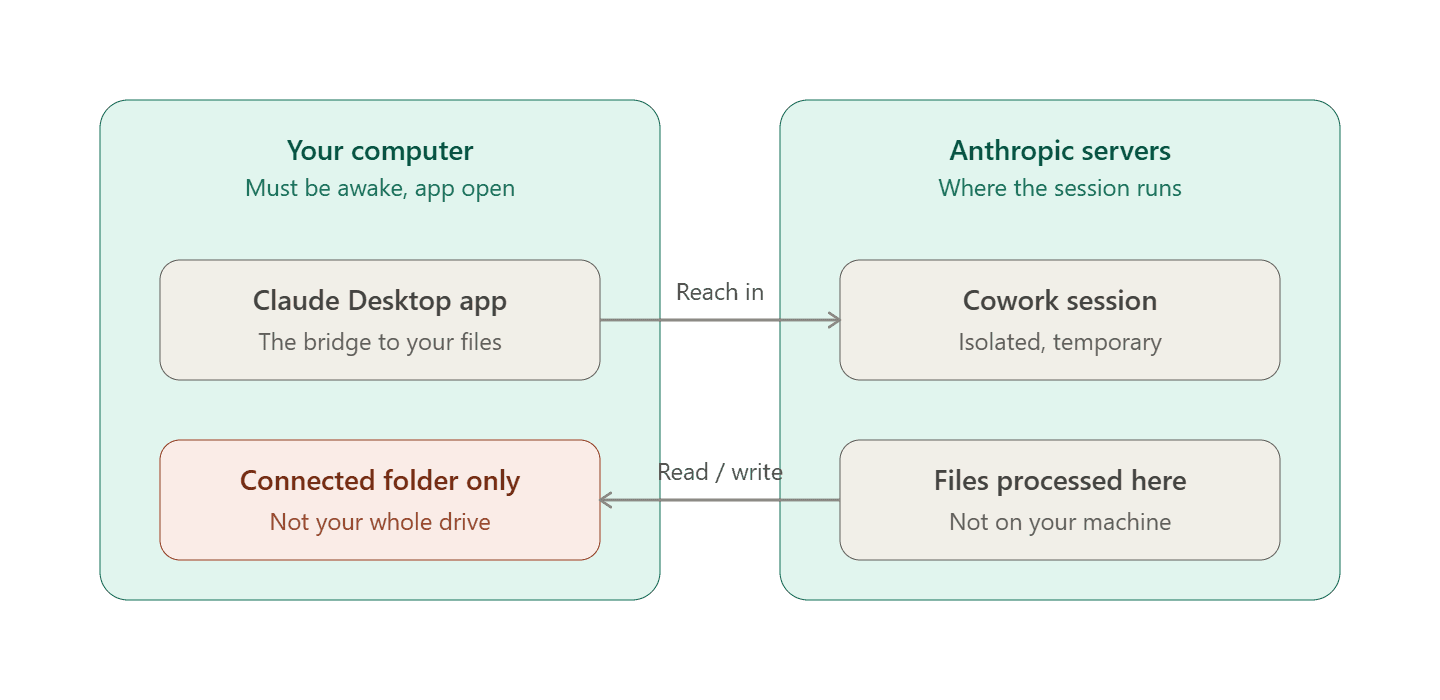
Two things about that architecture matter for finance work specifically, and they cut in opposite directions.
The first is that Cowork sessions run remotely on Anthropic's servers, not on your laptop. When Claude reads your close package file through the desktop app, the contents are processed on Anthropic's infrastructure — not because Cowork is malicious, but because that's how the compute is wired. For close package files that carry real financials, real customer names (Cigna, HCSC, Express Scripts, all of that is right there on slide 13), and pre-release earnings data, that's a data-handling question you'd want to run past whoever owns your company's AI policy before flipping it on. Not different in kind from any cloud tool touching close materials — but worth a conscious decision, not a default.
The second is that access is genuinely scoped. Cowork doesn't get your whole drive. It gets the folder you point it at, and only while the desktop app is open. Close the app and the remote session loses its window into your machine, even if it's still running. If you want to test the workflow with less sensitivity risk before committing, a dedicated "Claude scratch" folder with a dummy version of the deck gets you the full mechanic without exposing the real numbers.
Practically, if you're on a paid Claude plan and comfortable with the data handling, the Cowork setup is the closest thing to "just work on my file" that exists today. Chat still works the way it always did — attach the file, get one back — and for a lot of monthly refreshes that's actually fine, because the friction is small and the security surface is smaller too.
Where the leverage actually is
The trap in this whole conversation is treating the deck as the point. It isn't. The deck is the wrapper for the work. What actually takes time in a monthly close package refresh isn't the layouts, or the fonts, or the coral quarter-circle in the corner — those don't move. What takes time is the flux commentary. The reconciliations. The variance callouts on the balance sheet slide that have to reflect this month's mix and not last month's. The two-line summaries under the summary consolidated results table. The prose on slide 4 explaining why FY revenue lifted since March. The specific decision about whether the $1.2M direct mail investment gets called out as a watchpoint again this month or gets folded into a broader operating cost note.
That's where Claude is genuinely useful, and where the workflow choice actually matters. Path A (reuse-and-refresh) minimizes the mechanical work of updating the file so more of your time goes to the commentary and the reconciliations. Path B (rebuild lean) gives you a file where the mechanical work stays cheap forever, at the cost of a one-time visual migration. Cowork removes the upload-download loop so the mechanical work can happen against your live file. All three are variations on the same question: what fraction of your close package time is Claude removing from the boring middle so you can spend it on the parts that require you.
You can't hand off the judgment. The FP-vs-actual variance on operating expenses this month either has a real story behind it or doesn't, and telling the difference is exactly what a strategic finance person is paid to do. But you shouldn't be spending forty minutes updating table cells and re-typing flux commentary that only shifts by two words month over month. The deck should be the last five percent of your time on the close, not the first fifty.
Published: